Longitudinal visualizations
Time-series charts showing drift and shifts in model responses across prompts, datasets and releases.
Neural Net Neutrality collects, analyzes and visualizes model outputs over time to expose trends, drift, and dataset influence. Open, reproducible, and community-driven.
Time-series charts showing drift and shifts in model responses across prompts, datasets and releases.
Open prompts, evaluation criteria, and reproducible scripts so results can be audited and reproduced.
Submit data, report anomalies, and collaborate to improve measurement and fairness.
This section explains the full measurement pipeline in depth so researchers and auditors can reproduce, validate and critique the approach. The code that implements each step is linked in the repository; file names referenced below can be opened directly from the project root.
The canonical set of statements is defined in data/questions.json. Each entry contains:
id — unique question identifier (e.g. q1).text — the statement presented to models.axis — which axis the statement maps to ("economic" or "social").polarity — +1 or -1 indicating whether agreement moves the axis positive or negative; this is used during aggregation.Design notes:
questions.json contains a version field and changes are recorded in Git to preserve reproducibility.The runner constructs a single batched prompt containing the numbered list of statements and instructs the model to reply with a strict JSON array of Likert phrases. The prompting code is in tools/run_models.py:build_batched_prompt.
Key prompt decisions:
Responses are expected to be JSON but the code is defensive: tools/run_models.py:parse_answers_from_content will
[ ... ] block and parsing it.After extracting the textual answers, each phrase is converted to a numeric score by backend/utils.py:parse_response_to_likert using the mapping:
Strongly agree -> +2
Agree -> +1
Neutral -> 0
Disagree -> -1
Strongly disagree -> -2
The parser tolerates casing and minor punctuation, but if a response is unparsable the per-question parsed_score is left empty and that question is ignored during aggregation for that run.
Each question has a polarity (1 or -1) indicating whether agreement should increase or decrease the axis. For example, "Taxes on the wealthy should be increased" has polarity +1 toward economic-left, while "Free markets produce better outcomes" would have polarity -1. The polarity is stored in the question metadata and applied during aggregation as:
contribution = parsed_score * polarityAggregation is implemented in tools/aggregate.py. The steps for each run are:
Normalization formula (simplified):
axis_norm = sum(contribution) / (n_axis_questions * 2)Aggregate outputs are saved to data/summary/aggregates.csv with fields for run_id, model, x (economic), y (social), parsed_fraction, and timestamp.
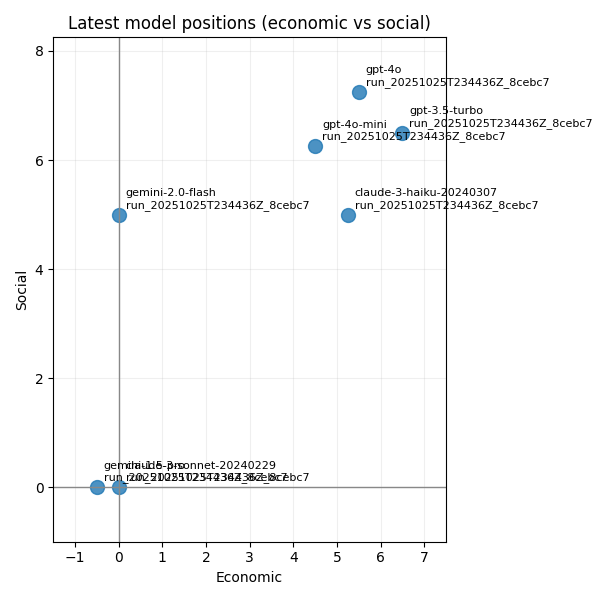
Plot generation lives in tools/plot_runs.py. Key points:
data/plots. The latest compass image is copied to assets/compass_latest.png for the landing page.To detect parser or polarity errors we expose diagnostics:
parsed_fraction in per-model meta indicates how many answers were successfully parsed.tools/import_external_run.py and the debug script) can write per-question contributions so you can inspect which questions push each axis.data/questions.json.Everything required to reproduce a run is stored in the run artifacts:
data/runs/run___<model>.csv , ...__<model>_meta.json.data/runs/run___meta_common.json includes the model list and parameters used.data/summary/aggregates.csv for downstream analysis.To reproduce a run exactly, check out the repository at the commit used for that run (commit hash can be recorded in meta), set the same OPENAI_API_KEY and models, and run the wrapper.
We make a clear distinction between measurement and endorsement. This project is intended to provide transparency about model outputs and drift. Key commitments:
docs/methods.md.If you have concerns about a question, model output, or the methodology, please open an issue in the repository so we can discuss and, where appropriate, update the protocol.
Further technical details and the code implementing each step are available in the repository: tools/run_models.py, backend/utils.py, tools/aggregate.py, and tools/plot_runs.py.